Dashboard Reporting
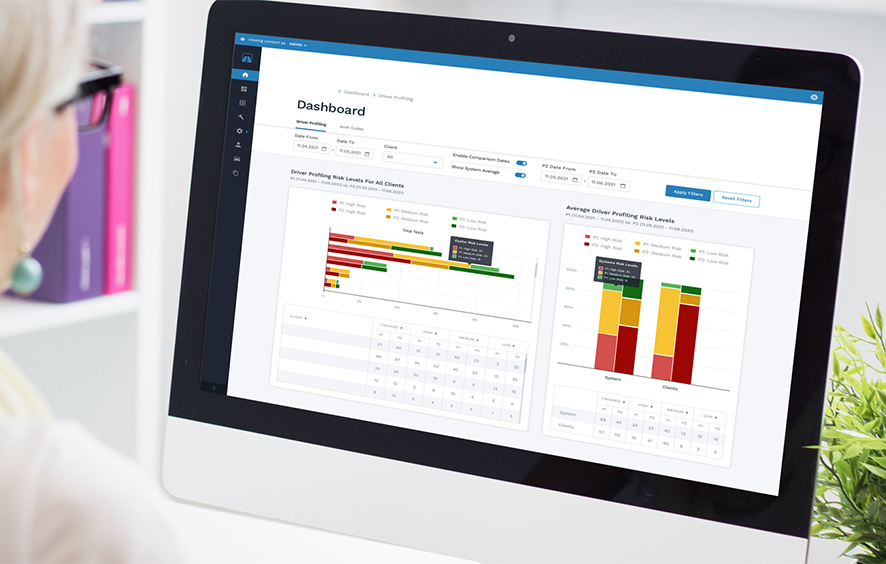
The dashboard reporting offers extensive flexibility to analyse driver data – as follows:
- Risk ratings for each risk category
- Compare your risk ratings with the system averages
- Averages across multiple divisions (if you have divisions set up in your system)
- Compare averages for 1 division against others (if you have divisions set up in your system)
- Compare 1 division against the entire system average (if you have divisions set up in your system)
- Input date ranges and compare 1 date range against another
- Switch quickly between charts and graphs, and tabular data
- View E-driver training modules usage, and which are most popular
- View e-module scores and compare these with the overall system average
- Print reports and charts with ease for meetings and reviews